One Big Beautiful Bill: Exactly How Much More You'll Take Home in 2026
Most Americans will keep slightly more of their paycheck in 2026. But how much more depends heavily on your income level — and the differences are surprising.
We ran the numbers across five income levels using the official 2026 IRS brackets and our own calculator. Here's what actually changed and what it means for your wallet.
What the One Big Beautiful Bill Actually Did
Signed into law on July 4, 2025, the One Big Beautiful Bill Act (OBBBA) did three main things:
- Made the 2017 Trump tax cuts permanent — the seven brackets (10%, 12%, 22%, 24%, 32%, 35%, 37%) were set to expire at the end of 2025. They no longer will.
- Raised the standard deduction — single filers now get $16,100, up from $15,000 in 2025. Married couples get $32,200.
- Added new temporary deductions — tips, overtime pay, and auto loan interest are now partially or fully deductible.
Without this bill, 62% of Americans would have faced a tax increase in 2026 when the old cuts expired. That didn't happen.
The 2026 Tax Brackets (Official IRS Numbers)
These are the brackets used by our calculator, sourced directly from IRS Revenue Procedure 2025-19:
| Rate | Single Filers | Married Filing Jointly |
|---|---|---|
| 10% | Up to $12,400 | Up to $24,800 |
| 12% | $12,400 – $50,400 | $24,800 – $100,800 |
| 22% | $50,400 – $105,700 | $100,800 – $211,400 |
| 24% | $105,700 – $201,775 | $211,400 – $403,550 |
| 32% | $201,775 – $256,225 | $403,550 – $512,450 |
| 35% | $256,225 – $640,600 | $512,450 – $768,600 |
| 37% | Over $640,600 | Over $768,700 |
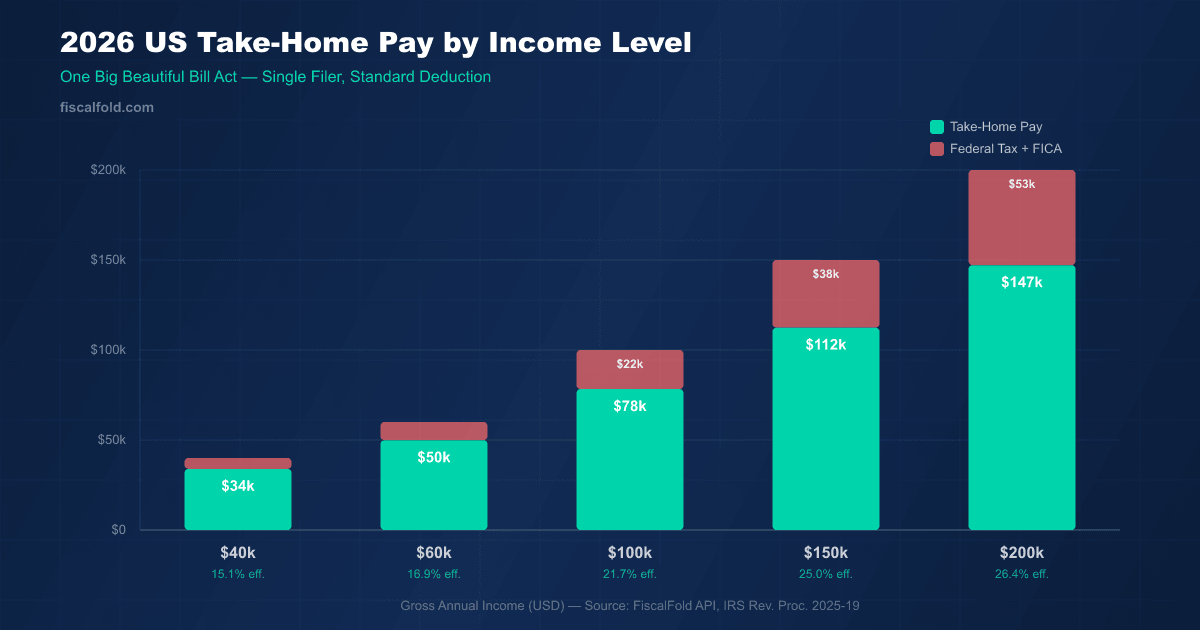
How Much Are You Actually Taking Home?
We calculated take-home pay at five income levels for a single filer using the standard deduction. These numbers come directly from our calculator using the 2026 IRS brackets and include federal income tax plus FICA (Social Security + Medicare):
| Gross Income | Federal Tax | FICA | Total Deducted | Take-Home Pay | Eff. Rate |
|---|---|---|---|---|---|
| $40,000 | $2,620 | $3,420 | $6,040 | $33,960 | 15.1% |
| $60,000 | $5,020 | $5,130 | $10,150 | $49,850 | 16.9% |
| $100,000 | $13,170 | $8,550 | $21,720 | $78,280 | 21.7% |
| $150,000 | $24,734 | $12,825 | $37,559 | $112,441 | 25.0% |
| $200,000 | $36,734 | $16,139 | $52,873 | $147,127 | 26.4% |
All numbers above are verified against our calculator using official 2026 IRS bracket data (Rev. Proc. 2025-19). Calculate your exact take-home pay →
The Changes That Matter Most by Income Level
If you earn under $50,000
The biggest win is the expanded 10% and 12% brackets. These two lowest brackets received an additional inflation adjustment — meaning more of your income is taxed at the lowest rates. A single filer earning $40,000 keeps $33,960 after all federal taxes and FICA, with an effective combined rate of just 15.1%.
If you earn $50,000 – $150,000
This is where the permanent standard deduction increase matters most. Going from $15,000 to $16,100 as a single filer means $1,100 less in taxable income. Combined with widened brackets, middle-income earners see the most proportional benefit. At $100,000, you keep $78,280 — nearly four-fifths of your gross pay.
If you earn over $200,000
The benefit is real — a $200k earner keeps $147,127 after federal taxes and FICA, with an effective rate of 26.4%. However, this is tempered by a new cap on itemized deductions for those in the 37% bracket. If you itemize and earn over $640,600, your deductions are now limited to 35 cents of benefit per dollar — down from 37 cents.
If you receive tips or overtime pay
This is the most significant new benefit. Tips are now tax-free up to $25,000 per year for service industry workers. Overtime premium pay (the "half" in time-and-a-half) is also now deductible up to $12,500 for single filers. For a restaurant server earning $20,000 in tips, this is potentially $2,400+ back in their pocket.
The One Change Nobody Is Talking About
The standard deduction now exceeds the federal poverty line for singles.
A single taxpayer earning $15,000 in 2026 pays zero federal income tax — the $16,100 standard deduction wipes out their entire taxable income. This is quietly significant: it means the bottom 20% of earners are completely outside the federal income tax system.
They still pay FICA (7.65% for most workers), but their federal income tax bill is $0.
How Does the US Compare to Other Countries in 2026?
The OBBBA kept US taxes relatively low by developed-world standards. Here's how a $100,000 earner compares globally — all numbers from our calculator:
| Country | Take-Home on $100K | Total Tax + Social | Effective Rate |
|---|---|---|---|
| Canada | $80,046 | $19,954 | 20.0% |
| United States | $78,280 | $21,720 | 21.7% |
| United Kingdom | $73,574 | $26,426 | 26.4% |
| Germany | $60,731 | $39,269 | 39.3% |
| France | $52,771 | $47,229 | 47.2% |
At $100k, a US worker keeps $25,509 more than a French worker and $17,549 more than a German worker. Even compared to Canada — the most tax-friendly peer — the US trails by just $1,766.
The Bottom Line
The One Big Beautiful Bill delivered on its core promise: most Americans will see slightly larger paychecks in 2026. The average benefit is modest — a few hundred dollars per year for middle-income earners — but the permanence is what matters. You can now plan your finances with confidence that these rates aren't expiring next year.
The biggest winners are tipped workers, overtime earners, and high-income households. The middle class gets steady, reliable relief. Lower-income households not in the federal tax system gain nothing from bracket changes but also lose nothing — and the expanded standard deduction means fewer people owe federal income tax at all.
Calculate your personal numbers
All calculations use official 2026 IRS bracket data. Your actual tax liability depends on deductions, credits, and filing status.